


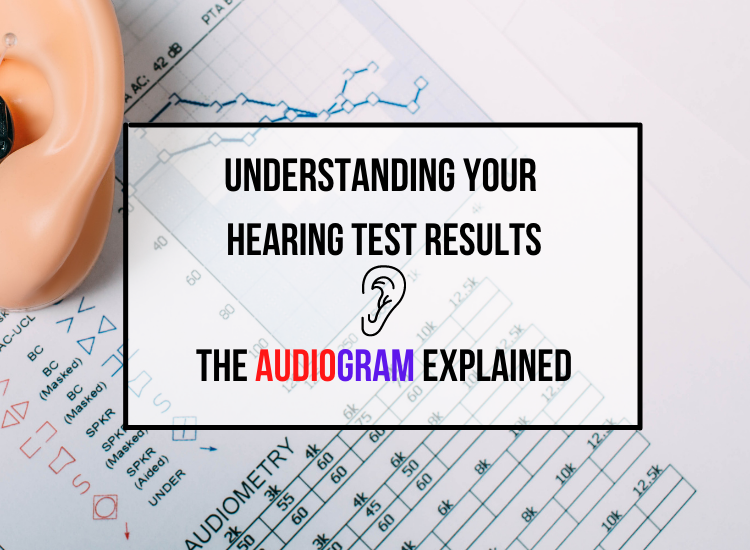
Your hearing test result – the audiogram explained…
You have taken the very important step of having your hearing tested, well done! People with a hearing loss often wait years to take action; this is a very long unnecessary time to live with a problem that could easily be treated. Do you know how to interpret your hearing test results, better known as the ”AUDIOGRAM”? Let us take you through the basics…
What is my diagnosis?
The results of your hearing test are plotted on a graph which is called the audiogram. This shows the degree of hearing loss, as well as the type of hearing loss. It also shows your ability to hear sounds at certain pitches or frequencies. Frequencies from left to right show the low to higher pitched sounds and from the top to bottom shows the soft to loud sounds. On the left you can see what the degree of your hearing loss is.
But what does this mean to me?
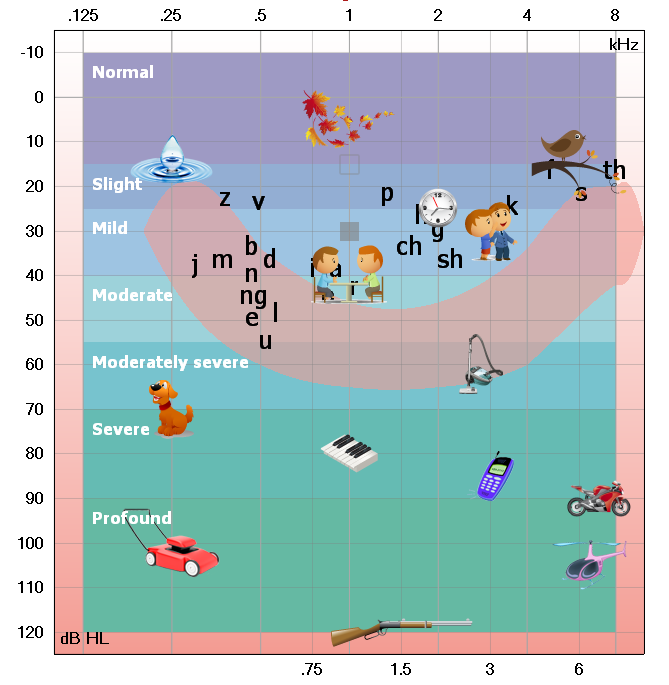

Hearing loss is typically classified according to severity. This will give you a broad indication of the level of difficulty each level of severity poses.
Mild:
Difficulty hearing faint or distant speech, even in quiet but especially in noisy situations.
Moderate:
Hears conversational speech only at a close distance, background noise and group situations increases problem.
Moderate-severe:
Hears loud conversational speech, anything softer is difficult to follow, especially when not having any visual cues such as lip-reading.
Severe:
Cannot hear conversational speech –will hear loud environmental sounds, almost impossible to follow any conversations without lipreading, even in a quiet one on one conversation.
Profound:
May hear loud environmental sounds, very little or no speech at all; speech reading is essential.
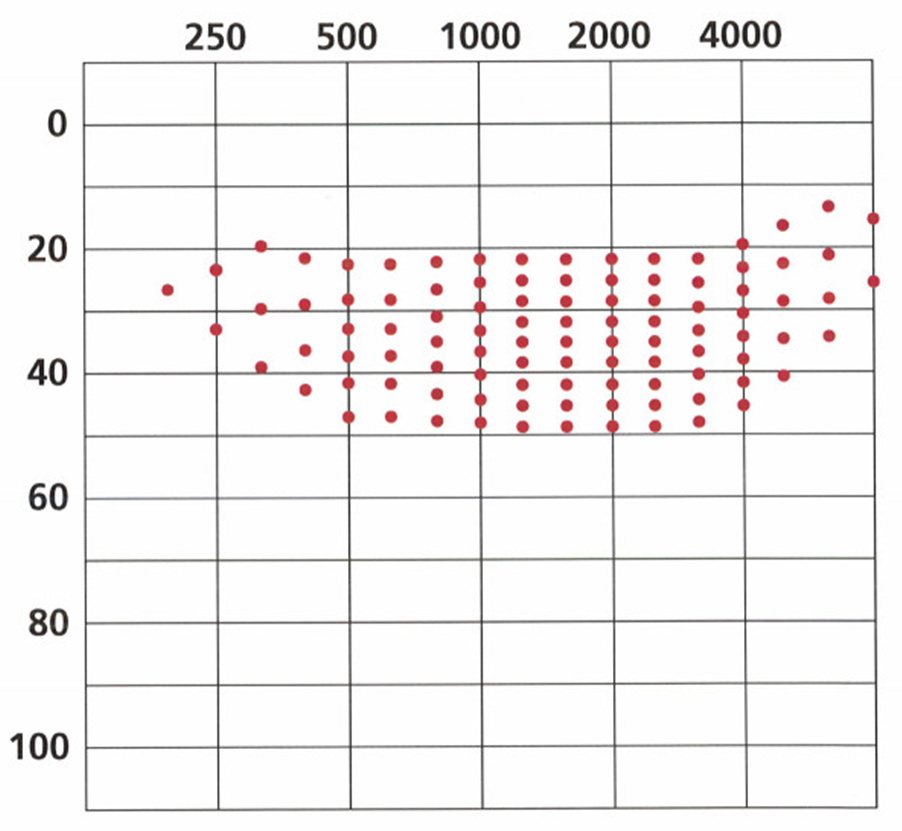

In a similar way, you can use the ‘Count the dot audiogram” that will give you a ‘Speech Intelligibility Index” score. This will give you some more information on how well you can hear speech sounds specifically – because lets be honest, it really is about speech and communication!
Step 1: Plot your audiogram on the count-the -dot template – each ear separately
Step 2: Count the amount of dots above the line
Step 3: Subtract this count from 100
Step 4: Your result indicates your speech intelligibility index
The Count-the-Dots Audiogram provides a way to estimate the ability to hear the acoustic energy of speech sounds. The more dots that occur below your hearing threshold line, the more speech energy you will perceive. This is a score out of 100. For instance – if there are 25 dots above the line, it roughly translates to around a 25% loss of speech intelligibility. and a 75% speech intelligibility score.
TIPS:
- Red is always the RIGHT ear results, and blue the LEFT ear.
- There might be different symbols used on your audiogram – it is just different ways for audiologists to know how the result was acquired.
- There might be two lines on each side – the lines usually describes the Air conduction and bone conduction results – this has more to do with the type of hearing loss – ask your audiologist to explain that to you! Use the bottom line always to determine the degree of hearing loss or with the count the dot audiogram.
![]()

Centurion – Wierdapark: 012 653 3830
Centurion-Saxby Medicross: 087 944 1803
Benoni – Northmead: 011 425 0171